Bruker AM300 Statistics

| ||
| Statistics start date: | 1 January 1998 | |
| Date of last record: | 20 July 2026 | |
| Spectra registered in 2026: | 13965 | |
| Total spectra in 1998 - 2026: | 773531 | |
| 2D Spectra in 1998 - 2026: | 8562 | |
| 3D Spectra in 1998 - 2026: | 30 | |
| Maximum spectra per day: | 485 (27 March 2018) | |
| Maximum spectra per week: | 1456 (week start 21 Jun 1999) | |
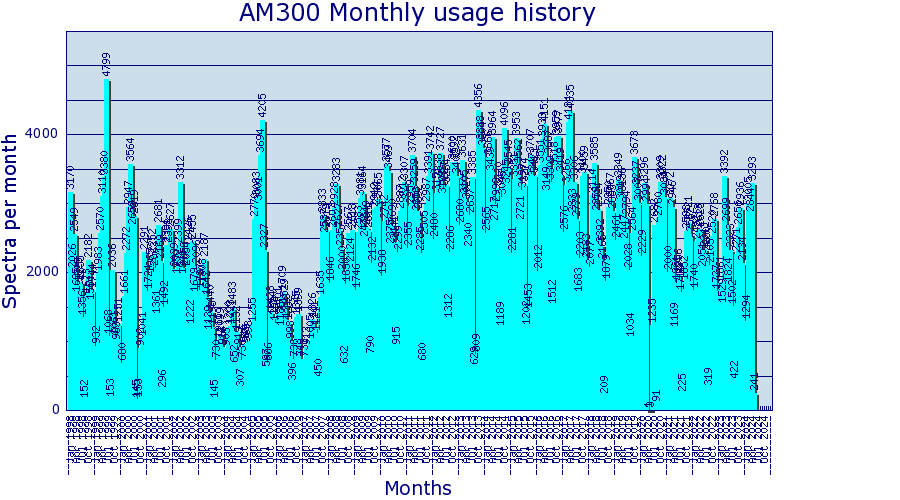
| Maximum spectra per month: | 4799 (Jun 1999) | |
| Maximum spectra per year: | 40177 (2016) |