Bruker av300 Statistics

| ||
| Statistics start date: | 6 June 2017 | |
| Date of last record: | 20 July 2026 | |
| Spectra registered in 2026: | 19883 | |
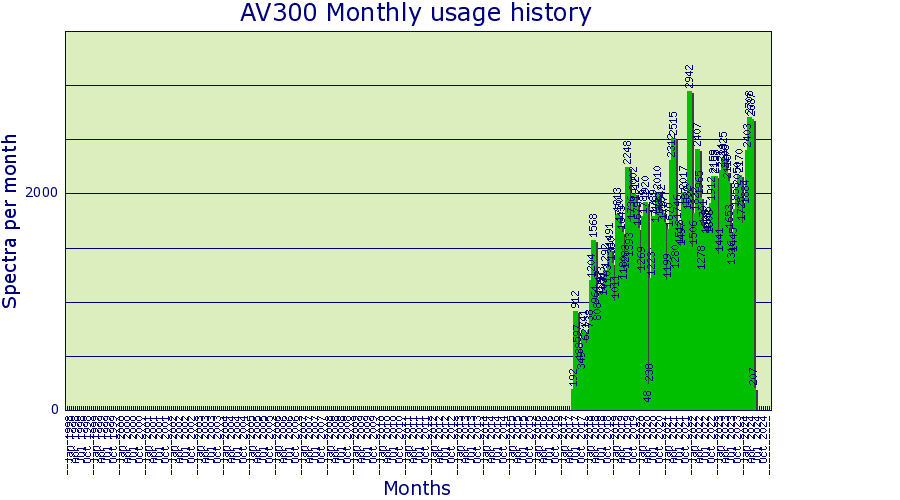
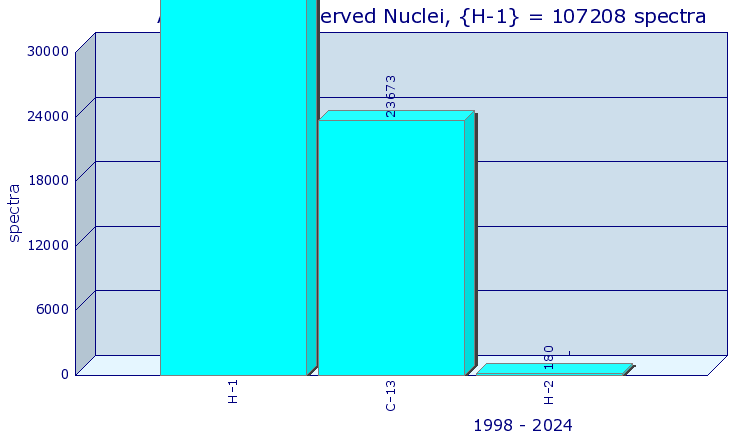
| Total spectra in 1998 - 2026: | 203903 | |
| 2D Spectra in 1998 - 2026: | 5932 | |
| 3D Spectra in 1998 - 2026: | 0 | |
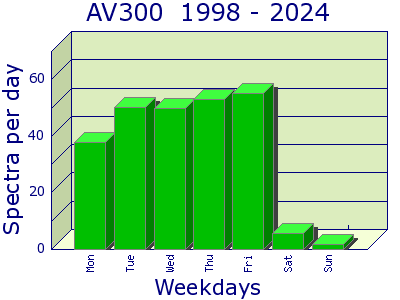
| Maximum spectra per day: | 295 (19 April 2019) | |
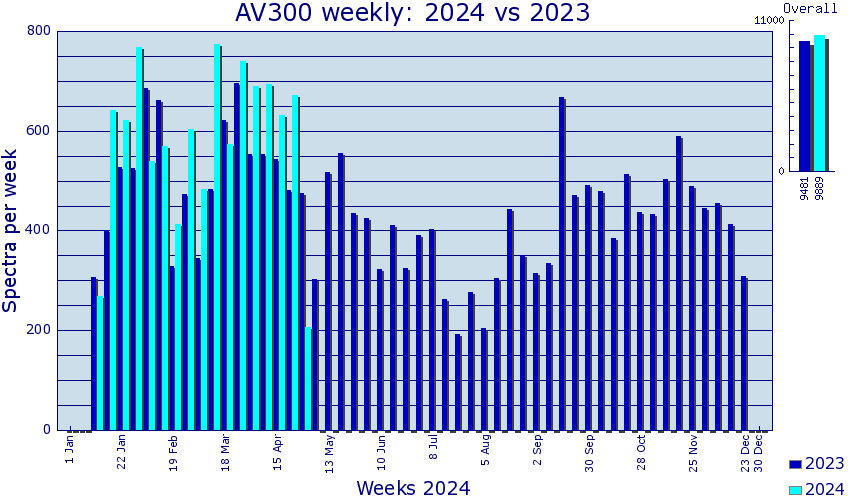
| Maximum spectra per week: | 957 (week start 8 Dec 2025) | |
| Maximum spectra per month: | 3440 (Dec 2025) | |
| Maximum spectra per year: | 32851 (2025) |