Bruker av300n Statistics

| ||
| Statistics start date: | 4 April 2018 | |
| Date of last record: | 21 July 2026 | |
| Spectra registered in 2026: | 22179 | |
| Total spectra in 1998 - 2026: | 179869 | |
| 2D Spectra in 1998 - 2026: | 20288 | |
| 3D Spectra in 1998 - 2026: | 54 | |
| Maximum spectra per day: | 246 (23 January 2026) | |
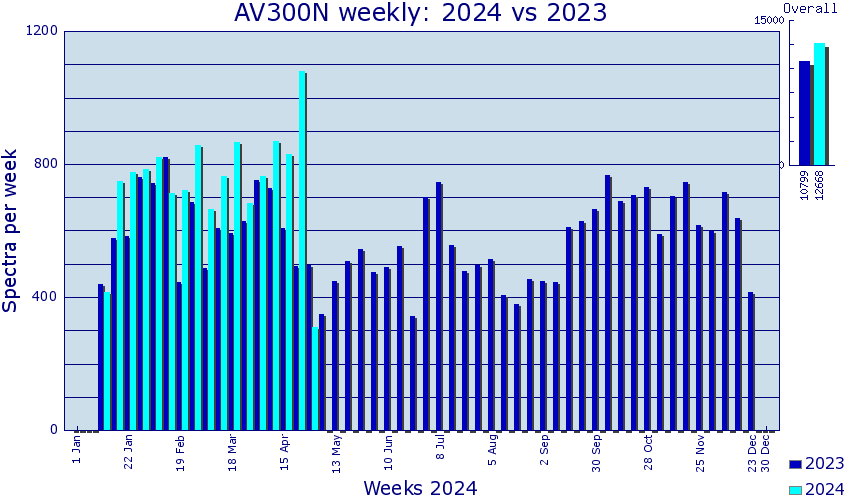
| Maximum spectra per week: | 1083 (week start 22 Apr 2024) | |
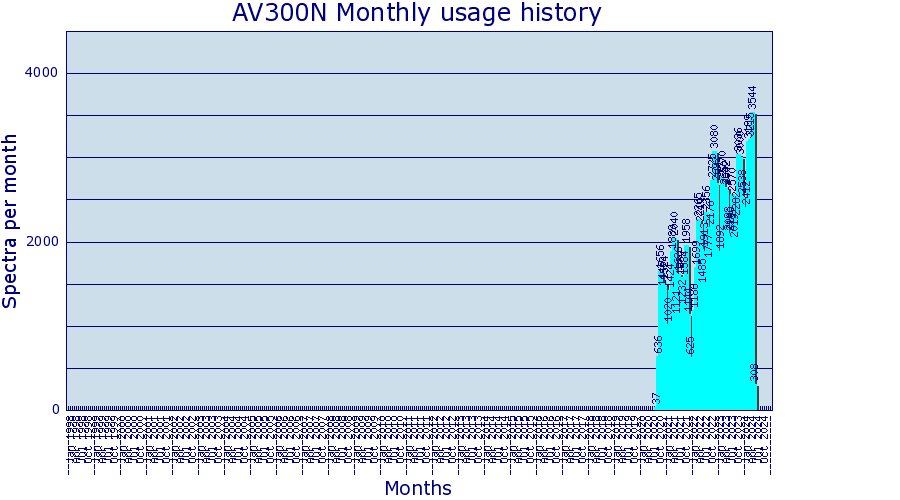
| Maximum spectra per month: | 3831 (Apr 2026) | |
| Maximum spectra per year: | 40004 (2025) |